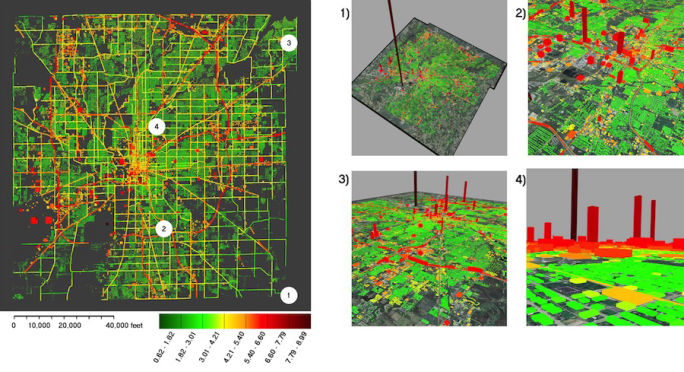
Figure 5 from Gurney et al., 2012. This paper is an overview paper of the Hestia Project. Units are log(10) kgC/year.
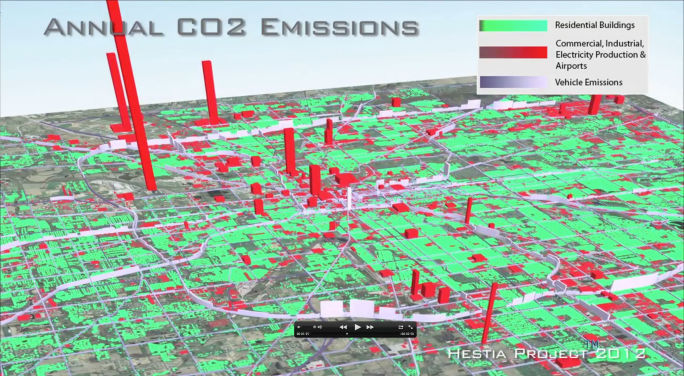
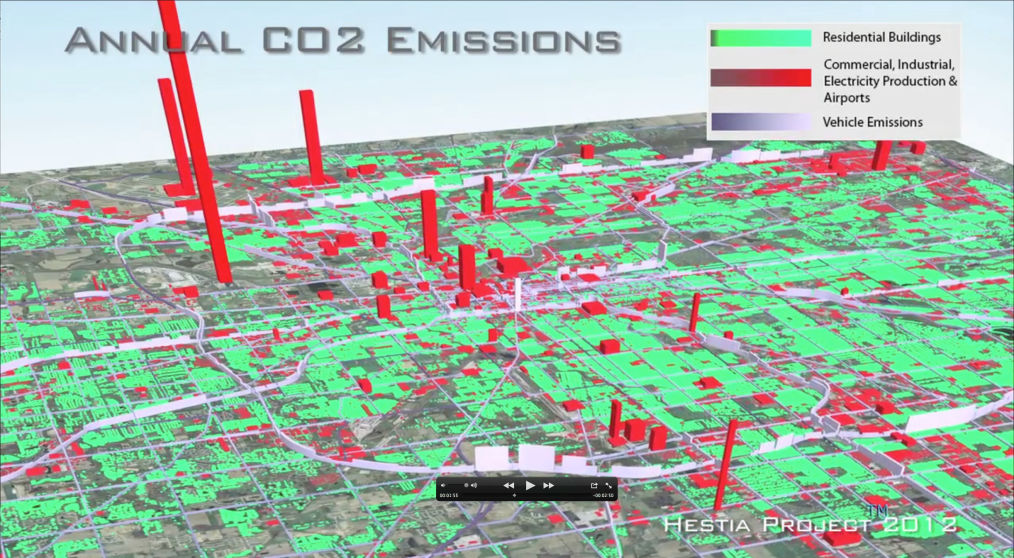
A still image from the Hestia-Indy animation (see below for the complete animation video).
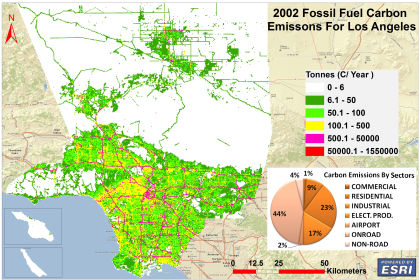
A graphic depicting FFCO2 emissions from the Los Angeles Basin with sector breakdown for the year 2002. See video below!
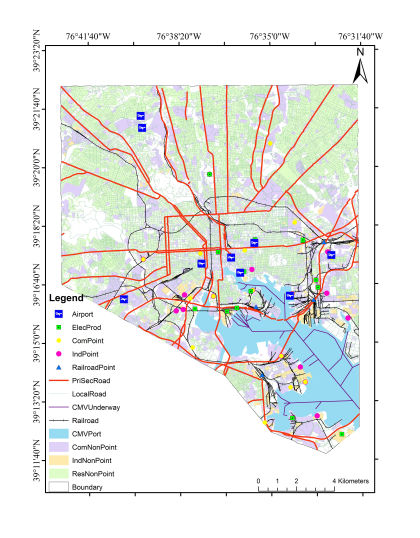
A graphic showing the sector geographies in the Hestia-Baltimore domain
Picture taken at the launch of the Hestia-Indianapolis system with Dr. Kevin Gurney, Indianapolis mayor and Purdue University's Dean Vitter.
1295 S. Knoles Dr. Building 90
Flagstaff AZ 86011
Email: kevin.gurney@nau.edu
Phone: +1 (480) 965-4556

Offline Website Software